Fix Emulator High CPU Usage, GPU and Disk Load
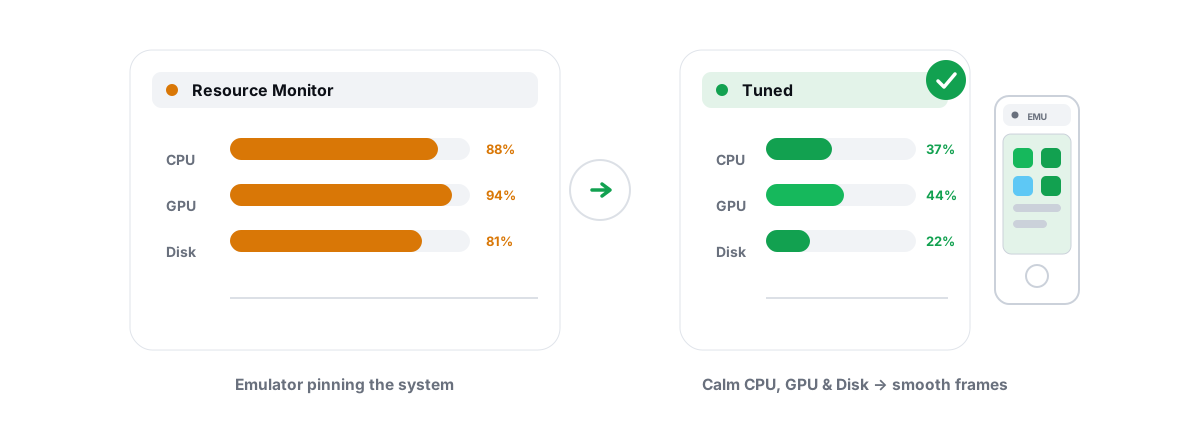
An Android emulator runs a whole virtual machine on your PC, so it is supposed to be heavy. Emulator high CPU usage, a maxed GPU, or a thrashing disk only mean something is wrong once you can tell that load apart from the load that's normal for a VM. This is a diagnostic guide: read the pattern, find the real cause, fix that instead of chasing placebo tweaks.
What "high usage" is normal for a VM and what isn't
An emulator boots a full Android system: kernel, Zygote, the launcher, Google services, plus the game. That is genuinely more work than a phone does, because your PC is emulating an ARM/x86 Android stack and compositing its screen through Windows on top of everything else you have open.
So before you "fix" anything, calibrate. Here is roughly what's expected versus what should make you start digging.
| Symptom | Usually normal | Probably a real problem |
|---|---|---|
| CPU while a 3D game runs | 40-70% of allocated cores, briefly higher on load screens | Pinned at 100% across all cores with stutter, or 100% on the menu |
| GPU | Steady use that tracks the frame rate | Near-zero GPU with high CPU (software rendering) or 100% GPU on a 2D game |
| Disk | A burst on launch and during installs | Sustained 100% disk minutes into a session, with audible thrashing |
| RAM | Whatever you allocated, sitting full | Windows itself swapping because you over-allocated |
The single most important calibration: a brief 100% spike on launch or while installing a game is fine. Sustained 100% on one resource, minutes into play, is the signal. Watch the pattern, not the peak.
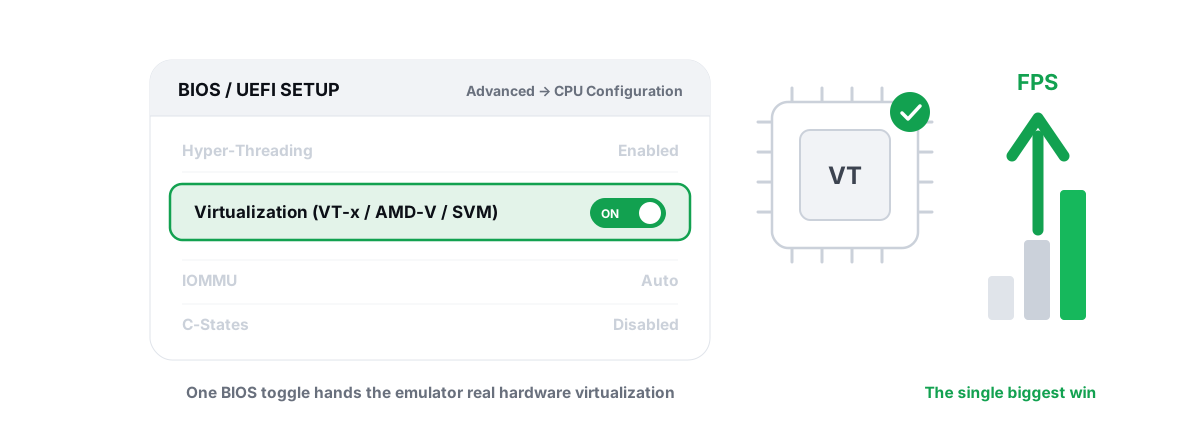
If virtualization is off in your BIOS, the emulator falls back to software CPU translation and pegs every core. Enabling Intel VT-x / AMD-V (SVM) is the single biggest fix and it costs nothing. Check that first, always.
Emulator high CPU usage: over-allocation and software fallback
Two causes account for most "emulator using all CPU" cases, and they pull in opposite directions.
Cause 1: virtualization is disabled (or the emulator can't use it)
With hardware virtualization on, your CPU runs the guest's instructions almost natively. With it off, the emulator software-translates every instruction, which is slow and burns cores. Open Task Manager, Performance tab, and look at the CPU panel: if "Virtualization" reads Disabled, that is your culprit.
Fix it in BIOS/UEFI (the setting is called VT-x, SVM Mode, or "SVM" on AMD boards). On Windows, Hyper-V and the Windows Hypervisor Platform can also fight the emulator for the virtualization layer — some emulators run better with Hyper-V on, some need it off, so test both. Our full walkthrough is here: enable virtualization (VT-x / AMD-V) for emulators.
Cause 2: you gave the emulator too many cores
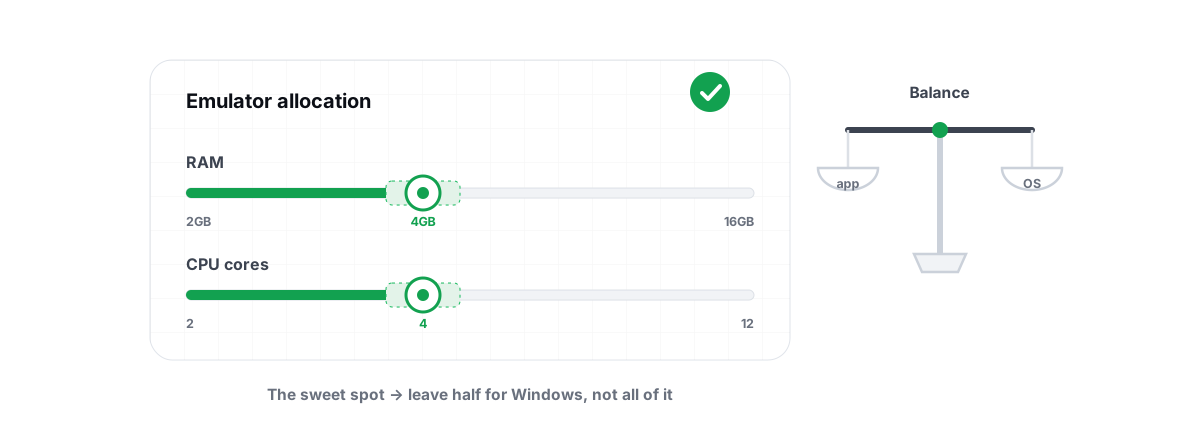
It feels backwards, but assigning every core often makes things worse. The emulator, the Windows compositor, your antivirus and the game all need CPU time. Hand the VM all your threads and Windows has nothing left to schedule itself with, so everything fights and stutters.
On a 6-core/12-thread chip like a Ryzen 5, allocate 4 cores to the emulator, not 12. On a 4-core CPU, give it 2-3. Leave headroom for the host. More guest cores past the point the game can use them just adds scheduling overhead.
If your whole system shows high CPU even outside the emulator, the emulator isn't the only problem. Walk the general checklist in how to fix high CPU usage on Windows first.
High GPU: renderer mismatch and uncapped frame rate
The emulator's graphics renderer decides whether your GPU does the work or your CPU fakes it in software. Picking the wrong one is the most common GPU-side mistake.
Match the renderer to your GPU
Most emulators offer a graphics mode: OpenGL, DirectX, or Vulkan. The right pick depends on your GPU vendor and driver maturity:
- NVIDIA — OpenGL or DirectX usually behave best; try the newer "OpenGL+" / "DirectX+" modes your emulator exposes.
- AMD — Vulkan tends to be the strongest path on Radeon.
- Intel — OpenGL is the safe default.
If you see high CPU and near-zero GPU usage, the emulator is rendering in software. That's a renderer set wrong, a broken graphics mode, or an outdated GPU driver. Switch renderers, and if nothing draws on the GPU, update the driver cleanly — see how to update GPU drivers safely. There's a vendor-by-vendor renderer guide at best renderer for emulators: OpenGL vs Vulkan.
Cap the frame rate
An uncapped emulator will happily render a menu at 1000 FPS and run your GPU hot for no reason. If your monitor is 60 Hz or 144 Hz, cap the emulator's FPS target to match. You get the same visible smoothness with far less GPU load, less heat, and less coil whine.
For competitive shooters where high frame rate matters, set the cap to your display's refresh, not "unlimited". 90 or 120 is plenty; 500 is wasted heat. If you're chasing high frame rates on emulator specifically, read how to get 90/120 FPS on an Android emulator.
Set the resolution sanely
Running an emulator at 1080p or 2K when you're playing on a 1080p monitor in a window means the GPU is rendering more pixels than you can see, then downscaling. Match the emulator's internal resolution to the window you actually play in. On a weaker GPU like a GTX 1050 Ti, 720p often plays noticeably smoother than 1080p with no real visual loss in a fast mobile game.
High disk: antivirus scans, paging and image location
Sustained high disk usage during a session is rarely the game itself reading data. It's almost always one of three things.
Antivirus scanning the emulator's disk image
Emulators store the Android system on a multi-gigabyte virtual disk image. Real-time antivirus — Microsoft Defender included — can scan that image as it changes, which means heavy disk I/O the whole time you play. Adding the emulator's data folder as a Defender exclusion stops the constant re-scanning.
Be honest about the trade-off: an exclusion means that folder isn't actively scanned, so only exclude the emulator's own data directory, and only if you trust your APK sources. Don't disable Defender system-wide — that's a real security hole for a placebo gain, and we explain why in should you disable Defender for gaming.
Windows is paging because RAM is over-allocated
Give the emulator more RAM than you can spare and Windows starts swapping to the pagefile to cover itself. That swapping is sustained disk activity, and on a hard drive it thrashes audibly. The fix isn't a bigger pagefile — it's allocating the emulator less RAM so Windows keeps a working margin. The "make the pagefile huge" advice is a myth we debunk here.
The emulator lives on a slow drive
If your emulator image sits on a mechanical hard drive, every texture load, install and app launch waits on spinning platters. This is where a genuinely slow emulator usually comes from on older PCs. Moving the emulator to an SSD is one of the few changes that gives a large, obvious improvement.
If you're deciding whether it's worth it, SSD vs HDD for gaming covers the real difference, and most emulators have a setting or a clean reinstall path to relocate the image to a faster drive.
Using the live monitor to find the real culprit
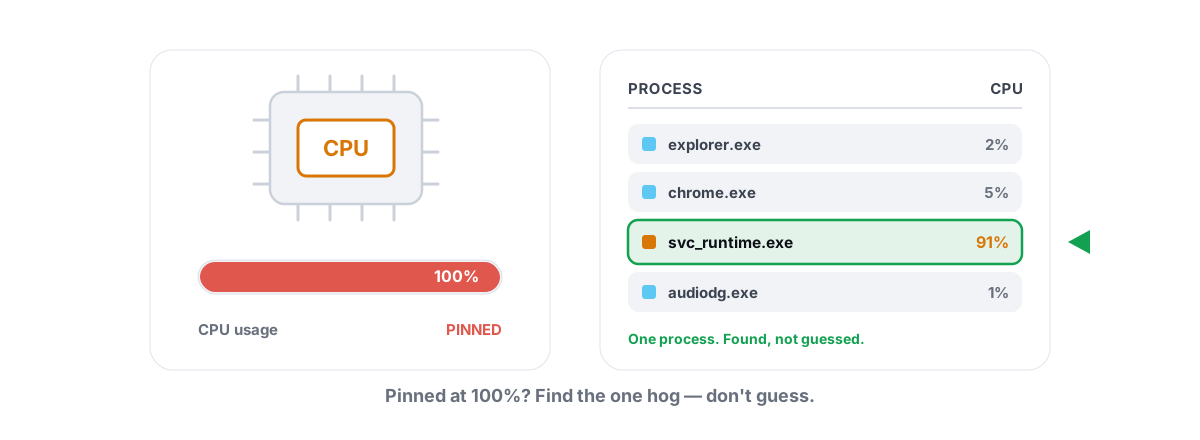
Don't guess which resource is the bottleneck — measure it. Open Task Manager's Performance tab and watch CPU, GPU, Disk and Memory while you play a tough scene. Three patterns tell you almost everything:
- CPU pinned, GPU low → software rendering (wrong renderer) or virtualization off. Fix the CPU side.
- GPU pinned, CPU moderate → resolution or FPS cap too high. Lower them.
- Disk pinned, CPU and GPU moderate → antivirus scanning, paging, or a slow drive. Work through the disk section above.
A live overlay makes this easier because you read the numbers while the game runs instead of alt-tabbing. BRUTAL Optimizer's free FPS overlay shows CPU, GPU, RAM and FPS — including 1% lows and frametimes — and it works over emulators. It counts DWM composition / D3DKMT present frames rather than hooking the game, so it's anti-cheat-safe. The same app's live monitor graphs the four resources over time so a recurring spike is easy to spot. If a hitch every few seconds is the real complaint, fixing stutter and frametime spikes goes deeper than raw usage numbers.
Real Windows levers: priority, power plan, background trim
Once you know the bottleneck, a few real Windows levers help — none of them magic, all reversible.
Process priority. Raising the emulator's CPU and I/O priority lets Windows schedule it ahead of background apps during a session. It doesn't create new CPU; it just stops the emulator losing time to things like an updater waking up mid-match.
Power plan. On a laptop especially, a balanced or power-saving plan down-clocks the CPU and can cap your frame rate hard. Switching to a high-performance plan keeps clocks up. Windows power plans explained covers when this actually matters and when it doesn't.
Background trim. Closing the Chrome tabs, Discord overlay and download manager you forgot about frees CPU, RAM and disk for the emulator. Trimming startup bloat with the Startup Manager means less fighting for resources before you even launch the game.
All three are manual levers you can pull yourself: set process priority, switch the power plan, and trim startup apps by hand. The deeper automation — an emulator optimizer that auto-detects your running emulator, applies a tier-aware profile, raises priority and timer resolution, then reverts when you stop — is the part worth paying for. Honest split: the manual version is free; automation is the upgrade.
When the answer is honestly "your PC is the limit"
Sometimes the usage is high because the work is genuinely too much for the hardware, and no tweak changes physics. An emulator runs a VM plus the game plus Windows, so it needs more headroom than the same game on a phone.
If you're on 8 GB of total RAM, allocating 4 GB to the emulator leaves Windows gasping, and you'll swap no matter what you do. If your CPU is a low-core mobile chip without strong virtualization, software fallback or thermal throttling can cap you regardless of settings. The honest fixes there are real upgrades — more RAM, an SSD, a better CPU — not another optimizer pass.
What you can do on a weak PC: drop resolution to 720p, cap FPS to 30-60, lower in-game graphics, give the emulator only 2-3 cores and 2-4 GB RAM, and pick the lightest emulator for your hardware. Running an emulator smoothly on a laptop is built around exactly this constraint.
No optimizer can make a virtual machine lighter than the work it's doing. Anyone promising "2x emulator speed" from a tweak is selling you a meter, not a fix. Real gains here are a few to several FPS and fewer stutters — worth having, but not magic.
One more honest point, because it comes up: optimizing an emulator improves performance only. No legitimate tool hides your emulator from a game or helps dodge anti-cheat — trying to mask an emulator is itself a ban risk. Some titles detect emulators deliberately (PUBG Mobile / BGMI routes emulator players into emulator-only matchmaking, and a few games restrict emulator play). That's publisher policy, not something any tool should "fix" for you. More on that in is playing on an emulator bannable.
Confirming the fix held
Don't trust a one-time good session. Confirm the change is real and stable.
- Re-check Task Manager: is Virtualization now
Enabled, and is the resource that was pinned now sitting in a sane range? - Play the same demanding scene that triggered the problem and watch the live numbers — not the menu, the actual hard moment.
- Confirm the GPU is doing the rendering (GPU usage tracks the frame rate, CPU isn't pinned at 100%).
- Leave it running 15-20 minutes. Disk thrash from antivirus or paging often shows up only after a few minutes, not on the first frame.
- If you changed CPU cores, RAM or renderer, restart the emulator first — several settings only apply on the next boot.
If usage dropped and stayed down across a real session, the fix held. If it crept back, you fixed a symptom and not the cause — go back to the live monitor and read which resource pins now.
If you'd rather not do all of this by hand, BRUTAL Optimizer is the honest version of this workflow: a free FPS overlay and live monitor to find the bottleneck, free process-priority, power-plan and startup levers to ease it, and a clear, reversible Pro layer for auto-tuning emulators — with a System Restore point attempted before any big change. It's a user-mode wrapper over the tools Windows already ships, so it runs alongside anti-cheat without a kernel driver. Either way, the diagnostic in this guide works whether or not you install a thing.
Frequently asked questions
Why is my emulator using 100% CPU?
The most common cause is hardware virtualization being disabled, which forces the emulator to software-translate every CPU instruction and pegs all cores. Check Task Manager's Performance tab for Virtualization Enabled, and turn on VT-x or AMD-V (SVM) in BIOS. The second cause is over-allocating cores: hand the emulator about two-thirds of your physical cores, not all of them, so Windows keeps scheduling headroom.
Is high emulator CPU and GPU usage normal?
Some is expected because an emulator runs a full Android virtual machine plus the game plus Windows. A brief 100% spike on launch or during a game install is normal. Sustained 100% on one resource minutes into play is the real warning sign. Watch the pattern over a session, not the peak.
How do I stop my emulator causing high disk usage?
Three usual causes: real-time antivirus scanning the multi-gigabyte disk image (exclude just the emulator data folder if you trust your APK sources), Windows paging because you over-allocated RAM (give the guest less RAM, not a bigger pagefile), and the image sitting on a slow hard drive (move it to an SSD). The drive move is usually the biggest single improvement on older PCs.
Which emulator renderer reduces GPU load?
Match the renderer to your GPU: NVIDIA usually runs best on OpenGL or DirectX, AMD on Vulkan, and Intel on OpenGL. If CPU is pinned while GPU sits near zero, the emulator is rendering in software, so switch renderers and update your GPU driver. Also cap the frame rate to your monitor refresh and match resolution to your window to cut wasted GPU work.
Can BRUTAL Optimizer lower emulator resource usage without a ban risk?
Yes for performance, and it never hides the emulator. BRUTAL is a user-mode wrapper over tools Windows already ships, with no kernel driver, no DirectX hook and no injection, so it runs alongside anti-cheat. It improves performance only and never helps evade emulator detection. Emulator restrictions like emulator-only matchmaking are publisher policy that no tool should change.
Keep reading
 Emulators
Enable Virtualization for Emulator Speed: BIOS Guide
Enabling CPU virtualization in BIOS is the single biggest emulator speedup most people skip. Per-vendor steps plus the Hyper-V conflict nobody mentions.
 Emulators
How Much RAM for an Emulator (and How Many CPU Cores)?
More cores and RAM usually makes an emulator slower, not faster. Here are the sane numbers per PC tier and how to verify them.
 Windows Performance
Fix 100% CPU Usage in Windows Without Guesswork
A methodical trace from Task Manager to the exact culprit pinning your CPU - then the fix that actually matches it.
Stop guessing. Measure it.
BRUTAL Optimizer is the honest way to speed up Windows — 17 free modules, a real FPS overlay, verified disk cleanup and drive health. No kernel driver of our own, no game hooks, every setting change reversible.