Fix High RAM Usage in Windows (Without Boosters)
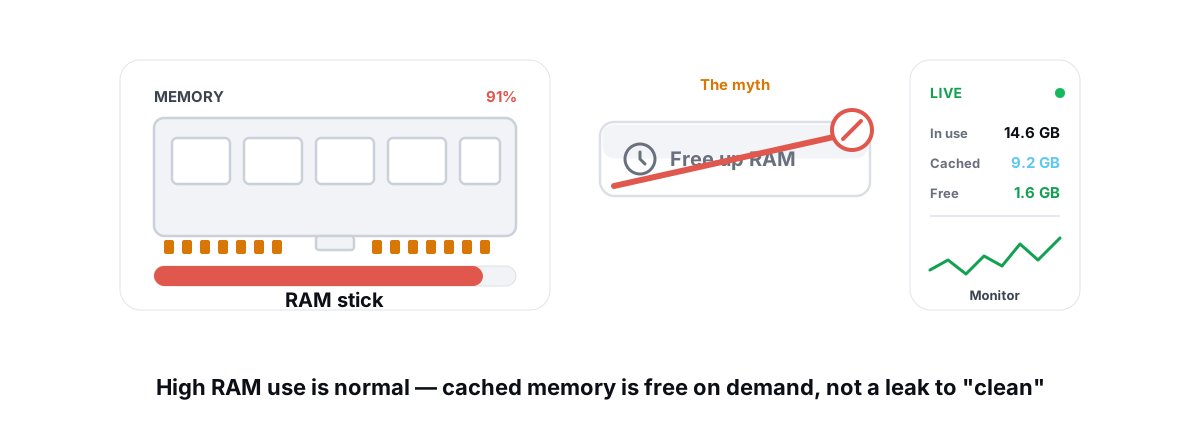
You open Task Manager, see RAM at 78 percent while you're "doing nothing," and assume something's broken. Usually it isn't. High RAM usage on Windows is mostly cache doing its job — and the real problem, when there is one, has a name you can find in two minutes.
Here's the thing most "memory optimizer" tools never tell you: empty RAM is wasted RAM. Windows fills it on purpose. The number that matters isn't In use — it's Available, and the difference between those two changes everything about how you read your own machine.
This guide shows you how Windows actually manages memory, how to read the real numbers, and how to find a genuine memory hog or leak with tools you already have. No boosters, no placebo.
Why high RAM usage on Windows is usually fine (used is not bad)
Reading from RAM takes nanoseconds. Reading from an SSD takes microseconds — a thousand times slower — and a hard drive is slower still. So Windows does the obvious thing: it keeps recently used programs, files, and DLLs sitting in memory after you're done with them, on the bet you'll want them again soon.
That's the SysMain service (the old "Superfetch") and the Windows cache manager working as designed. When you relaunch Chrome or reopen a document and it snaps up instantly, that's cached pages in RAM, not a fresh disk read. The OS is spending memory to buy you speed.
So a machine showing 70 or 80 percent memory "used" while idle is often a machine doing its job well. RAM that sits empty earns you nothing. Windows treats unused memory as a missed opportunity, and it's right to.
The goal of memory management isn't to keep RAM empty. It's to keep the right data in RAM. A high "used" figure with plenty of available memory is healthy, not broken.
This is exactly why one-click "free up RAM" tools mislead people. They drop the used number, you feel productive, and you've actually thrown away cache the OS will now have to rebuild from disk. We'll get to why that backfires below — and there's a fuller breakdown in what free RAM really means.
Standby, cached, and 'available': reading the real numbers
Open Task Manager (Ctrl+Shift+Esc), go to the Performance tab, and click Memory. Most people only look at the big percentage at the top. The numbers underneath are the ones that tell the truth.
| Field | What it actually means |
|---|---|
| In use | Memory actively held by running processes and the kernel. This is "real" usage. |
| Available | What apps can grab right now without waiting — free memory plus the standby cache. This is the number that matters. |
| Cached / Standby | Pages holding recently used data. Counted as available because Windows drops them instantly the moment something needs the space. |
| Free | Memory holding nothing at all. On a healthy system this is usually small, and that's fine. |
| Committed | Total memory promised to processes (RAM + pagefile), shown as used / limit. If the first number nears the second, you're genuinely tight. |
The trap is reading Free as "how much I have left." It isn't. Standby memory is available too — it's cache that gets evicted the instant a program asks. A machine with 200 MB free but 6 GB standby has roughly 6.2 GB ready to hand out.
So the honest health check is one line: look at Available, not In use. If Available stays comfortably above a gigabyte or two and the Committed figure isn't crowding its limit, you have enough memory. The high percentage at the top is cache, and cache is free performance.
Find the genuine hog: Task Manager and Resource Monitor
If Available really is low and the machine is swapping, something is genuinely eating memory. Now you go find it by name.
Task Manager: the quick pass
In the Details tab, sort by the Memory (active private working set) column. The top few rows are your candidates. A browser with 30 tabs, a game, a VM, or a creative app (Photoshop, video editors, DAWs) legitimately using several gigabytes is normal — that's what the RAM is for. What you're hunting is something using far more than it should, or growing without bound.
Watch the top process for a minute. Steady is fine. Steadily climbing while you do nothing is the signal we'll chase in the next section.
Resource Monitor: the detail Task Manager hides
Task Manager rounds and simplifies. For the real picture, type resmon into Start (or click "Open Resource Monitor" at the bottom of Task Manager's Performance tab) and open the Memory tab. Two columns earn their keep here:
- Working Set — total physical RAM the process holds, including memory shared with other processes.
- Private (Working Set) — memory that belongs to only this process. This is the honest "how much is this app personally costing me" number, because shared DLLs aren't double-counted.
Sort by Private descending. The bottom graph also shows your standby (cached) and free memory split out visually, so you can confirm with your own eyes that most of "used" is cache, not active load. Below that, Hard Faults/sec tells you whether you're actually thrashing the pagefile — sustained hard faults under load is the symptom of a true memory shortage, not a number on a meter.
Spotting a memory leak vs normal growth
A memory leak is a program that keeps requesting memory and never gives it back, even when it should be idle. Left alone, it climbs until the machine starts paging hard and everything crawls. The trick is telling a leak apart from an app that's simply busy.
| Normal growth | Actual leak |
|---|---|
| Rises when you give the app more work (open tabs, load a project), then plateaus. | Climbs steadily even while the app sits idle, with no new work given to it. |
| Drops back down when you close documents or tabs. | Never recovers — closing work doesn't release the memory. |
| Stays within a sane ceiling for what the app does. | Sails past any reasonable ceiling — a chat app at 8 GB, a tray utility at 4 GB. |
To confirm, leave the suspect process open and idle, and watch its Private working set in Resource Monitor over 10 to 20 minutes. Flat or sawtooth (up with work, down after) is healthy. A line that only ever goes up is a leak.
The fix for a leak is almost never a "cleaner." It's one of these:
- Restart the offending app. This fully reclaims the leaked memory and is the correct immediate fix.
- Update it. Leaks are bugs. The newer version may have patched it. (Buggy or mismatched drivers leak in kernel memory too — if your "Nonpaged pool" in Resource Monitor is huge, suspect a driver and check whether yours are current; our take on which drivers actually matter covers when that's worth doing.)
- Replace or report it. If a specific extension or plugin is the source, remove it.
Browser tabs and background apps: the usual suspects
Nine times out of ten, the "where did my RAM go" answer is the browser. Modern browsers isolate every tab and extension in its own process for security and stability, and each one costs memory. Thirty tabs plus a pile of extensions can easily run several gigabytes — and that's the browser working correctly, not malfunctioning.
Both Chrome and Edge have a built-in task manager (press Shift+Esc inside the browser) that breaks memory down per tab and per extension. That's how you find the one tab — usually a heavy web app, a video site, or a tab that's been open for days with a slow leak in its own JavaScript — that's eating the most.
Practical moves that actually reduce browser memory:
- Close tabs you're hoarding. The single most effective step, and it costs nothing.
- Audit extensions. Each one runs its own process. Remove the ones you forgot you installed.
- Turn on tab sleeping. Edge's "Sleeping tabs" and Chrome's "Memory Saver" suspend idle tabs and hand the memory back automatically. This is the legitimate, built-in version of what boosters pretend to do.
Background apps are the other half. Game launchers, chat clients, cloud sync, and "helper" tray utilities all hold memory while you're not looking. The fix isn't to kill them mid-session — it's to stop the ones you don't need from launching at all. Trimming your startup programs reduces idle memory pressure permanently, where a booster only does it for a few seconds.
When more RAM truly helps (and when it won't)
Sometimes the honest answer is that you don't have enough RAM, and no software trick changes that. Here's how to know which side of the line you're on.
More RAM helps when your Available memory is regularly near zero under your normal workload, the Committed figure keeps bumping its limit, and Resource Monitor shows sustained hard faults while you work. That combination means Windows is constantly shoving active data out to the pagefile and reading it back — the disk thrash you feel as the whole system stuttering. That's a real shortage. Adding physical RAM is the only true fix, and it's a good one.
More RAM won't help when Available is healthy and you just don't like the 75 percent number. Going from 16 GB to 32 GB when you never run out won't make anything faster — Windows will simply use the extra space for more cache. It's not wasted, but it won't speed up a machine that wasn't memory-starved. The bottleneck is somewhere else: CPU, GPU, or disk.
For gaming specifically, capacity matters far more than speed. 16 GB is the practical floor for modern titles, 32 GB is comfortable headroom, and once you have enough, faster RAM kits give single-digit-percent gains at best. We broke the trade-off down in more RAM vs faster RAM — the short version is buy capacity first, speed second.
Why a one-click 'RAM booster' makes things worse
RAM boosters work by force. They call a Windows function that trims a process's working set — shoving its pages out of physical RAM and onto the pagefile or the standby list — so the "used" number drops. The meter looks better. Nothing got faster.
Then it backfires three ways:
- You evicted useful cache. The standby memory the booster "freed" was holding data Windows expected to reuse. Now it has to read it back from disk. You traded fast RAM hits for slow disk reads.
- Active apps stall. If the booster trimmed a program you're actually using — say, a game — the moment that app touches the trimmed memory it page-faults, and if the pages went to the pagefile the CPU stalls waiting on the disk. In a game that shows up as a frametime spike — a stutter you caused.
- Scheduled boosters repeat the damage. Tools that "auto-clean" every few minutes keep fighting the OS, forcing the same eviction-and-reload cycle on a loop.
Windows already balances all of this thousands of times a second, with full knowledge of what every process is doing. A timer-based tool that periodically dumps working sets has none of that context. It's optimizing a number on screen, not your actual experience.
A lower "used" number is not a faster computer. If a tool's whole pitch is making that number drop, it's selling you a meter, not performance.
A safe trim that Windows already does for you
There is a legitimate version of "freeing" memory, and the good news is you rarely have to do it — Windows handles it automatically. When a program needs RAM, the OS instantly converts standby cache back into free memory for it. No tool required, no stutter, because it only happens on demand.
The honest manual equivalents, in order of usefulness:
- Close what you're not using. Quitting a heavy app returns its memory cleanly. This is the real "free up RAM" button.
- Restart a leaking process. Identified a climber in the steps above? Restart it. Full reclaim, zero risk.
- Reboot if uptime is long. Weeks of uptime accumulate fragmentation and small leaks across many programs. A restart is the cleanest reset there is.
That's the whole list. Notice none of it involves a background process forcibly trimming working sets on a timer.
This is also why an honest optimizer won't ship a RAM-booster meter. BRUTAL Optimizer deliberately doesn't have one. It gives you the live CPU/GPU/RAM monitor and a per-process view so you can see what's really happening, then it leaves Windows' memory manager alone — because Windows is better at this than any periodic timer. It never injects into a game or trims working sets behind your back, so it runs fine alongside Vanguard, EAC, or BattlEye. But the fastest fix for high RAM usage is still free and needs no install: find the hog, close or restart it, and stop reading cache as a problem.
Frequently asked questions
Why is my RAM usage so high in Windows?
Most of it is cache. Windows keeps recently used apps, files, and DLLs in memory so they reload instantly, because reading from RAM is far faster than from disk. A high In-use figure while idle usually means the OS is doing its job. Check the Available number instead, not the percentage at the top.
Is high RAM usage bad?
Not by itself. Empty RAM earns you nothing, so Windows fills it with cache on purpose. It only becomes a problem when Available memory is regularly near zero under your normal workload and Resource Monitor shows sustained hard faults, which means the system is thrashing the pagefile.
How do I tell a memory leak from normal usage?
Watch the process Private working set in Resource Monitor while the app sits idle. Normal apps rise when you give them work then plateau, and drop when you close that work. A leak climbs steadily even when idle and never releases the memory. The fix is to restart or update the offending app, not run a cleaner.
Should I use a RAM booster to free up memory?
No. Boosters force apps to dump their working sets to the standby list or pagefile, which lowers the used number but evicts useful cache Windows then has to reload from disk. If they trim an app you are using, like a game, it stalls when it touches that memory again, showing up as stutter. The number drops, nothing gets faster.
What actually frees up RAM in Windows?
Close apps you are not using, restart anything that is leaking, and reboot if your uptime is measured in weeks. Windows already converts cache back into free memory the instant a program needs it, so no background tool is required. If Available is consistently low under normal use, add physical RAM.
Keep reading
 Myths & Honest Truths
Do RAM Boosters Work? What Free RAM Really Means
Why free RAM is wasted RAM, how aggressive trimming causes stutter, and the rare times a memory tool actually helps.
 Hardware & Drivers
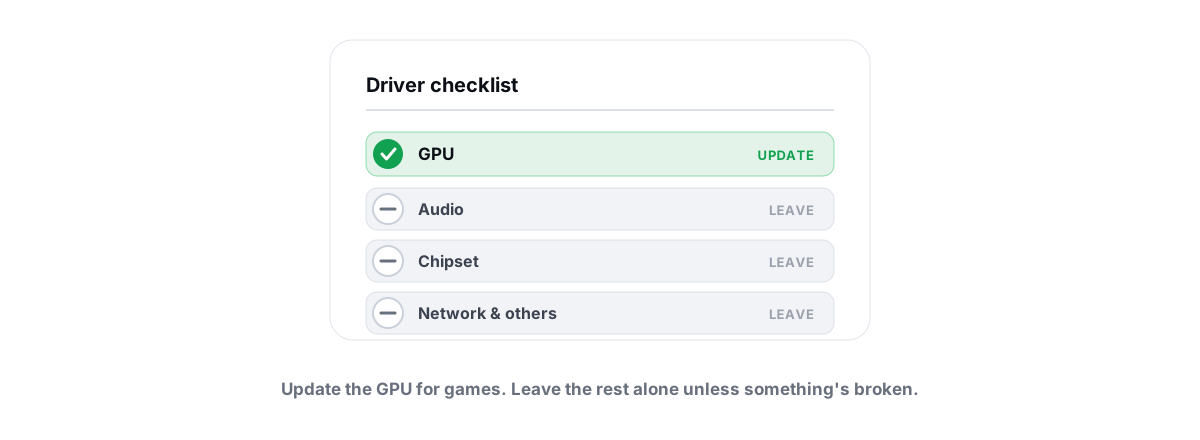
Should You Update Drivers? Which Matter, Which to Skip
Most driver updates do nothing. Here is which ones actually matter, which to skip, and why driver-updater tools are mostly bloatware traps.
 Myths & Honest Truths
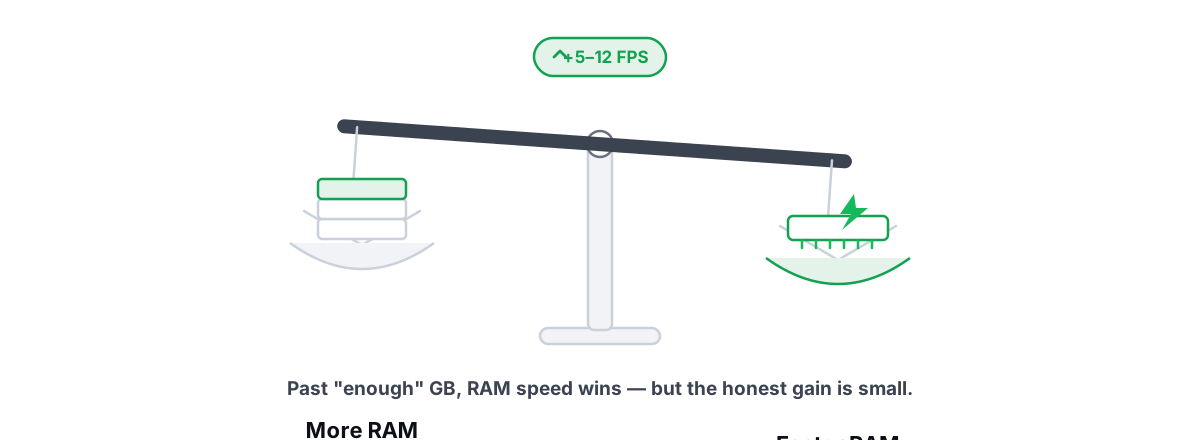
More RAM vs Faster RAM: What Actually Helps Gaming
Capacity is a floor and speed is the slope: why 16GB is usually enough, and where RAM speed and dual-channel actually buy FPS.
Stop guessing. Measure it.
BRUTAL Optimizer is the honest way to speed up Windows — 17 free modules, a real FPS overlay, verified disk cleanup and drive health. No kernel driver of our own, no game hooks, every setting change reversible.