How to Read a Traceroute: Find Your Lag's Real Source
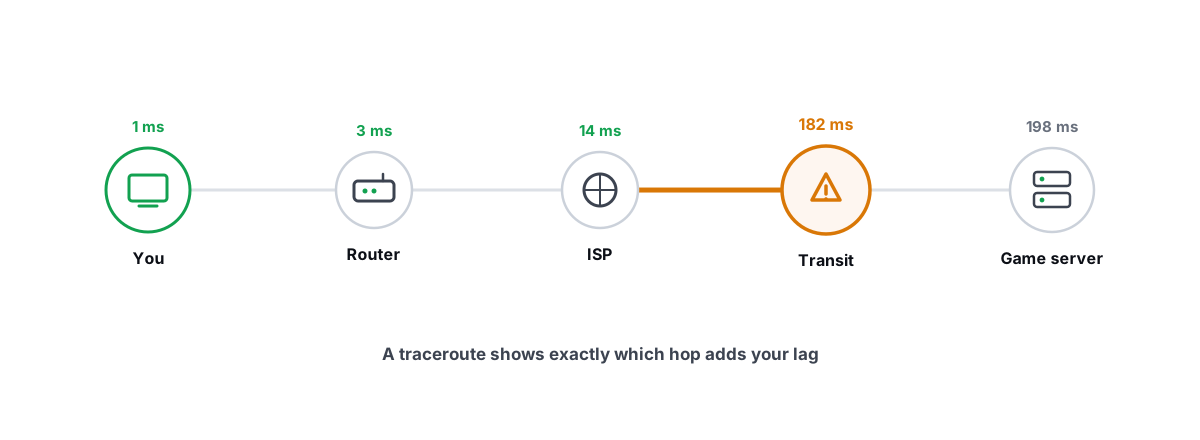
When a match feels laggy, the question that actually matters is simple: is it your router, your ISP, or the game server? A traceroute answers that — once you learn how to read a traceroute instead of just staring at the numbers.
Most "fix your ping" advice skips the diagnosis and jumps straight to tweaks. That's backwards. A traceroute maps the path your packets take to a server and times each step along the way, so you stop guessing and start pointing at the real culprit. This guide shows you how to run a real ICMP trace, classify every hop, and tell a genuine problem from noise that looks scary but means nothing.
What Traceroute Shows You, Hop by Hop
Your packets don't fly straight to a server. They pass through a chain of routers — your home router, your ISP's local gear, regional backbone, long-haul transit, then the server's network. Each of those is a hop.
Traceroute reveals that chain by abusing a field in every IP packet called TTL (Time To Live). TTL is a hop counter. Each router decrements it by one, and when it hits zero the router throws the packet away and sends back an ICMP "Time Exceeded" message — which conveniently tells you that router's address.
So traceroute sends a packet with TTL=1 (dies at the first router, which identifies itself), then TTL=2 (dies at the second), and so on, climbing one hop at a time until it reaches the destination. The round-trip time of each reply is the latency to that hop.
A traceroute is a map plus a stopwatch. The map is the route; the stopwatch is how long it takes a reply to come back from each point on that route.
One thing to fix in your head right now: each hop's time is measured independently from your PC. Hop 7 showing 40 ms does not mean hop 7 "added" 40 ms. It means a reply from the seventh router took 40 ms round trip. What you care about is how the numbers grow down the list, not any single value.
Running a Real ICMP Traceroute
Windows ships with a tracer built in. Open Command Prompt or PowerShell and run:
tracert -d play.example-game-server.com
The -d flag skips reverse-DNS lookups so the trace runs faster and doesn't stall on hops that won't resolve. Drop it if you want router hostnames (they often hint at the city and carrier — useful later).
A few practical notes that change what you see:
- Windows
tracertuses ICMP echo by default. That's fine for diagnosing, but some routers deprioritize or rate-limit ICMP, which produces fake-looking spikes. More on that below. - Trace the actual server, not a website. A game's matchmaking server and its login web page can live in completely different places. If you can find the in-match server IP (your game's netgraph, or a connection inspector), trace that.
- Run it three or four times at different moments — idle, and while a match or download is loading. A path that's fine when idle but ugly under load is a bufferbloat fingerprint, not a routing problem.
Each line shows up to three probe times (traceroute sends three per hop) plus the hop address. Three numbers per hop also tells you about consistency: 22ms 23ms 21ms is healthy; 22ms 180ms 24ms is a single jittery probe, usually harmless.
tracert -d server.com > trace.txt). If you end up reporting a problem to your ISP, a timestamped trace is the single most useful thing you can attach.Classifying Hops: Home, ISP, Transit, Server
The whole skill of reading a trace is grouping hops into zones, because the zone tells you who can fix the problem. Here's the typical shape of a trace and how to label it.
| Zone | Where in the list | How to recognize it | Who owns it |
|---|---|---|---|
| Home | Hop 1 (sometimes 2) | A private address like 192.168.1.1 or 10.0.0.1; latency under ~2 ms | You |
| ISP access / regional | Hops 2–5ish | Hostnames with your city or carrier name; latency a few to ~20 ms | Your ISP |
| Transit / backbone | Middle hops | Carrier names (e.g. Cogent, Lumen, Tata), big geographic jumps | ISP + peering partners |
| Server edge / datacenter | Last 1–3 hops | The destination's hosting network (AWS, Cloudflare, the game's ASN) | The game operator |
The first hop is your router. If hop 1 is anything but tiny, the problem is inside your house — Wi‑Fi interference, a saturated link, a dying powerline adapter — and no amount of server-side blame will help. A wired connection and a clean local network are the prerequisites; if your whole PC feels sluggish too, that's a separate rabbit hole covered in why your PC is slow.
The last hops belong to the game operator. If everything is healthy until the final stretch and the destination itself is far away or busy, that's geography and server choice — pick a closer region if the game lets you.
How to Read a Traceroute's Latency Jumps
This is where reading a traceroute becomes a real skill. Latency should climb gradually as you get farther from home. A clean trace looks like a staircase: 1ms → 9ms → 14ms → 21ms → 38ms → 41ms. Each step is small, and once a number goes up it stays up.
Three patterns matter. Most of what scares people is the third — and it's usually nothing.
1. A jump that persists
If latency leaps from 20 ms to 90 ms at one hop and stays around 90 ms for every hop after it, that hop is a real bottleneck. The added delay propagated downstream because every later packet still has to cross that slow link. This is the signature worth investigating.
2. A jump on a geographic leap
A clean 60 ms increase between two hops that clearly crossed an ocean (a US hop to a European hop) isn't a fault — that's the speed of light doing its job. Light in fiber covers roughly 200 km per millisecond, and routes are never straight. Long distance simply costs latency.
3. A single high hop that drops back down
You'll often see one middle hop spike to 120 ms while the hops before and after it sit at 30 ms. People panic here. Don't. The next section explains exactly why this is almost always a non-issue.
Why a High Middle Hop Isn't Always the Problem
This is the most common misread, so it gets its own section.
Generating those ICMP "Time Exceeded" replies is not a router's job. Routers exist to forward packets, and they do that in fast dedicated hardware. Replying to an expired TTL is handled by the router's general-purpose CPU as a low-priority chore. Under load, that CPU answers your probe late — or not at all (you see *).
So a middle hop showing 120 ms can be a busy router that's slow to reply to you while still forwarding game traffic perfectly. The proof is right there in the trace: if the hops after the spike drop back to normal, the path through that router is fine. Latency to the destination is what counts, and it didn't inherit the spike.
Only believe a spike when it carries forward. A high hop followed by low hops is a tired router answering pings, not a broken route.
Same logic for asterisks. A row of * * * in the middle usually means that one router is configured not to answer ICMP at all — extremely common, and completely harmless if the trace continues past it. You only worry about timeouts when they start at a hop and never recover all the way to the destination.
Spotting an ISP Routing Issue You Can Report
Sometimes the trace shows a genuine problem that's not yours to fix but is yours to report. Here's what an actionable ISP issue actually looks like.
- A persistent jump inside your ISP's zone. Hops 2–5 carry your carrier's name and one of them adds 40 ms that every later hop keeps. That's congestion or a bad link on their network.
- A nonsensical detour. Your packets to a server two cities away route through another country first (hostnames betray the cities). Inefficient peering can add 50 ms for no physical reason.
- Sustained loss that starts mid-ISP. Timeouts or packet loss that begin at an ISP hop and continue to the destination — not a one-off star — point to a saturated or faulty link they own.
To make the report stick, bring evidence they can't wave away:
- Run the trace several times across different hours and save each one. One bad trace is anecdotal; five at different times is a pattern.
- Trace a second, well-connected destination (a major CDN) to show the problem is specific to one path, not your whole connection.
- Pair the trace with a sustained ping to the first bad hop showing the loss or latency over time. If you also see packet loss in matches, the steps in fixing packet loss and jitter help you measure it cleanly.
Give the ISP the hop address, the latency or loss you measured, the times, and the comparison trace. That converts "my game lags" into a ticket their network team can act on.
Turning a Trace Into an Actionable Fix
A trace is a diagnosis, not a cure. Map what it told you to the right action — and notice how many "fixes" the trace just ruled out.
| What the trace shows | What it means | What actually helps |
|---|---|---|
| Hop 1 already high | Problem is in your home | Go wired, fix Wi‑Fi, check for a saturated link or bufferbloat |
| Persistent jump in ISP zone | Their congestion or bad link | Report it with saved traces; nothing on your PC fixes this |
| Clean staircase, high final ping | Server is just far away | Pick a closer region; consider a VPN only if it shortens the path |
| One high middle hop, low after | Busy router answering pings | Nothing — it's not a real problem |
| Fine idle, ugly under load | Bufferbloat at your line | Enable SQM/QoS on the router; test the grade |
Notice what isn't on that list: a "network booster," a registry tweak, or a magic ping-lowering toggle. None of those shorten the physical path or fix a congested ISP link. If your trace is clean and the destination is simply far, the honest answer is that you've hit a floor distance sets — and real ways to reduce ping are about path and queueing, not placebo.
Running traces, sustained pings, jitter, packet loss, a bufferbloat A–F grade, and a DNS benchmark by hand means juggling tools and parsing raw text. BRUTAL Optimizer's network lab runs a real ICMP traceroute with the hop classification described here, plus the bufferbloat grade and ping/jitter/loss in one place — all read-only diagnostics that change nothing on your system. It's a user-mode tool over what Windows already ships, with no kernel driver and no network-stack tampering, so it runs alongside Vanguard, EAC and BattlEye.
However you measure it, the trace tells you where the lag lives — and that's most of the battle. The rest is acting on the zone it points to, and refusing to "fix" hops that were never broken.
Frequently asked questions
What command runs a traceroute on Windows?
Open Command Prompt or PowerShell and run tracert -d followed by the server address. The -d flag skips reverse-DNS lookups so it runs faster. Drop -d if you want router hostnames, which often hint at the city and carrier.
Why does one middle hop show very high latency?
Routers reply to traceroute probes as a low-priority chore on their general CPU, so a busy router can answer your probe late while still forwarding game traffic fine. If the hops after the spike drop back to normal, the route is healthy and the spike does not matter.
What do the asterisks in a traceroute mean?
A row of asterisks means a router is configured not to reply to ICMP, which is common and harmless when the trace continues past it. Only worry about timeouts that start at one hop and never recover all the way to the destination.
How do I know if the lag is my fault or my ISP's?
Look at the zone. Hop 1 is your home router, so a high first hop means the problem is in your house. A persistent latency jump or sustained loss inside hops that carry your carrier's name points to your ISP and is worth reporting with saved traces.
Can a traceroute lower my ping?
No. A traceroute only diagnoses where delay comes from. If the path is clean and the server is simply far away, distance sets a floor no software can beat. The fix depends on the zone the trace points to, such as going wired, reporting an ISP link, or picking a closer server.
Keep reading
 Network & Latency
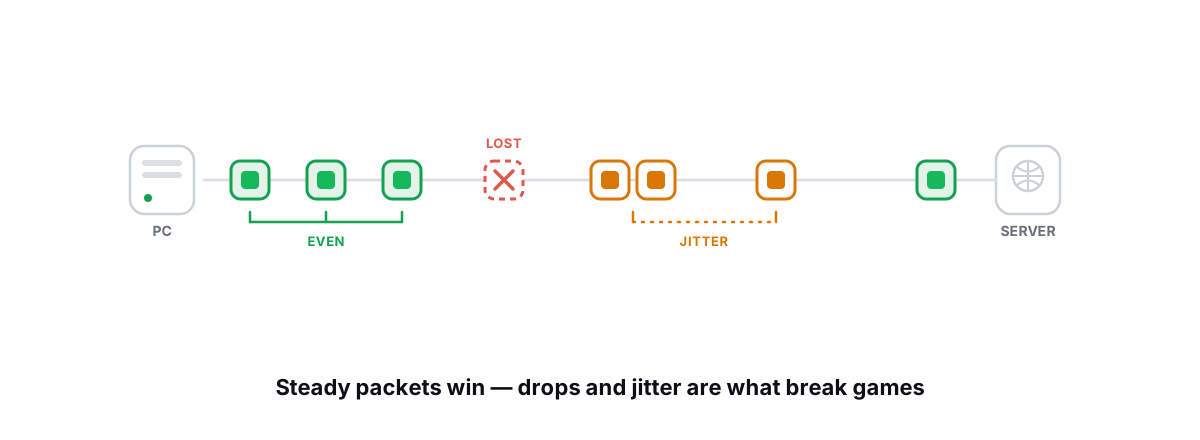
How to Fix Packet Loss and Jitter in Games
Measure loss and jitter properly over time, find where they come from, and fix the parts you actually control at home.
 Network & Latency
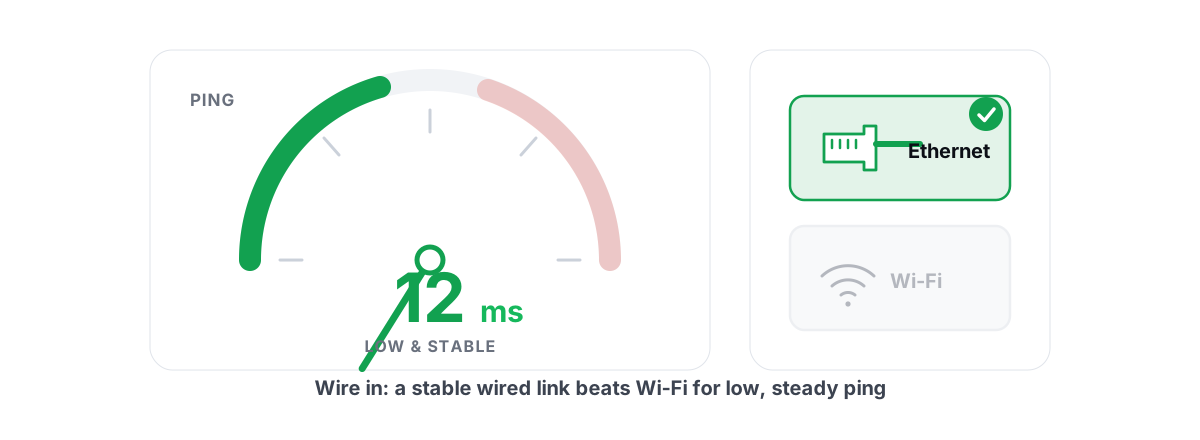
How to Reduce Ping in Online Games (Real Fixes)
Sort the ping you can fix - server, bufferbloat, Wi-Fi, routing - from the ping you can't, and skip the ping-booster snake oil.
 Network & Latency
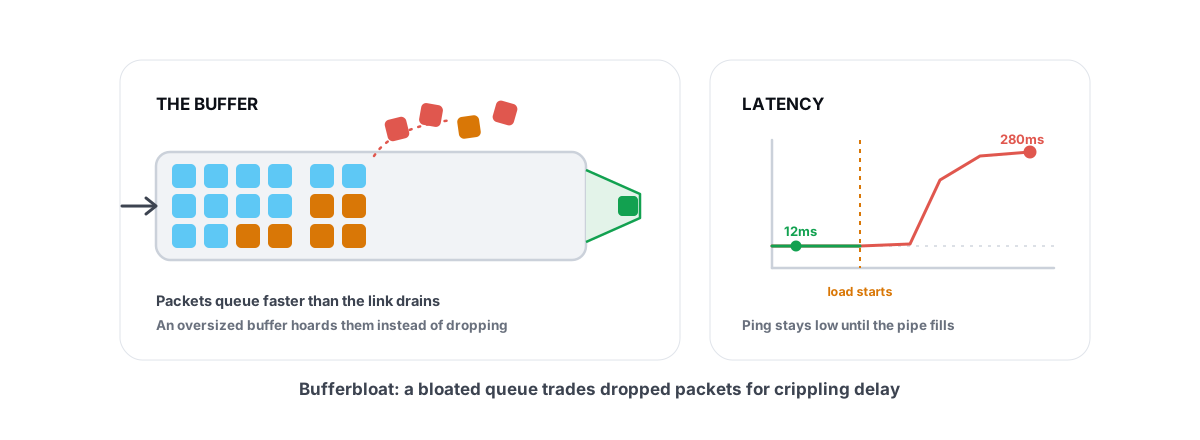
What Is Bufferbloat? The Hidden Lag in Your Net
Why your ping spikes the moment anything downloads, how to grade it A-F, and the one router-side fix (SQM) that actually works.
Stop guessing. Measure it.
BRUTAL Optimizer is the honest way to speed up Windows — 17 free modules, a real FPS overlay, verified disk cleanup and drive health. No kernel driver of our own, no game hooks, every setting change reversible.